
10 U.S. cities where residents are happiest
- Jaclyn DeJohn
- 0

Sean Pavone // Shutterstock
10 U.S. cities where residents are happiest
Money can't always buy happiness. However, quality of life can influence your financial decisions and outcomes. Depending where you live, certain quality of life factors, including metrics like life expectancy, infrastructure and the rate of marriage, can ultimately impact your happiness.
To find where Americans are happiest, SmartAsset evaluated 90 of the largest U.S. cities across 11 variables spanning personal finance, well-being and quality of life.
Key findings
- Arlington, Virginia is the happiest large U.S. city. Arlington ranks within the top 10 for many happiness metrics across finances, well-being and quality of life. Residents have the longest life expectancy at 85.3 years and get plenty of physical activity. An estimated 62.8% of individuals have over $100,000 in income, and the city has the second-lowest rate of poverty at 6.5%. Though when it comes to traffic, Arlington ranks particularly poorly with the third-highest rate of traffic.
- California has some of the happiest residents. Fremont, San Jose and San Francisco all make the top 10. Residents in these cities live well into their 80s and longer than most peers in other states. Also, more than 60% of residents earn $100,000 or more. There are also particularly high rates of health insurance coverage and residents getting physical activity.
- These Alaska and Hawaii cities have the best self-reported mental health. Anchorage and Honolulu respectively have the lowest reported number of mentally unwell days within a 30-day period: 3.6 and 3.7. New Orleans residents have the highest number of mentally unwell days per 30 at 6.0.
- Residents are least housing-cost burdened in Fort Wayne, Indiana. Only 9.8% of Fort Wayne pay more than half of their income toward housing. Other cities where residents are least burdened include Austin, TX (10.5% pay more than half of their income toward housing); Boise, ID (10.5%); Oklahoma City, OK (11.1%); and Wichita, KS (11.3%) also have some of the least housing-cost burdened residents. Meanwhile, New Orleans, LA residents (25.6%) face the highest rate of housing squeezing incomes.
- Seattle residents get the most exercise. When it comes to getting exercise, 86.1% of Seattle residents are active. In large U.S. cities, the average is 77.0%.
- The Austin, Texas area has the lowest rate of traffic studywide. Compared to the amount of roadway, Travis County has an average traffic volume per meter of major roadway at 137.7. On the other hand, residents living in and around Boston, Massachusetts in Suffolk County face the highest traffic volume per square meter of major roadway at 6,821.6.

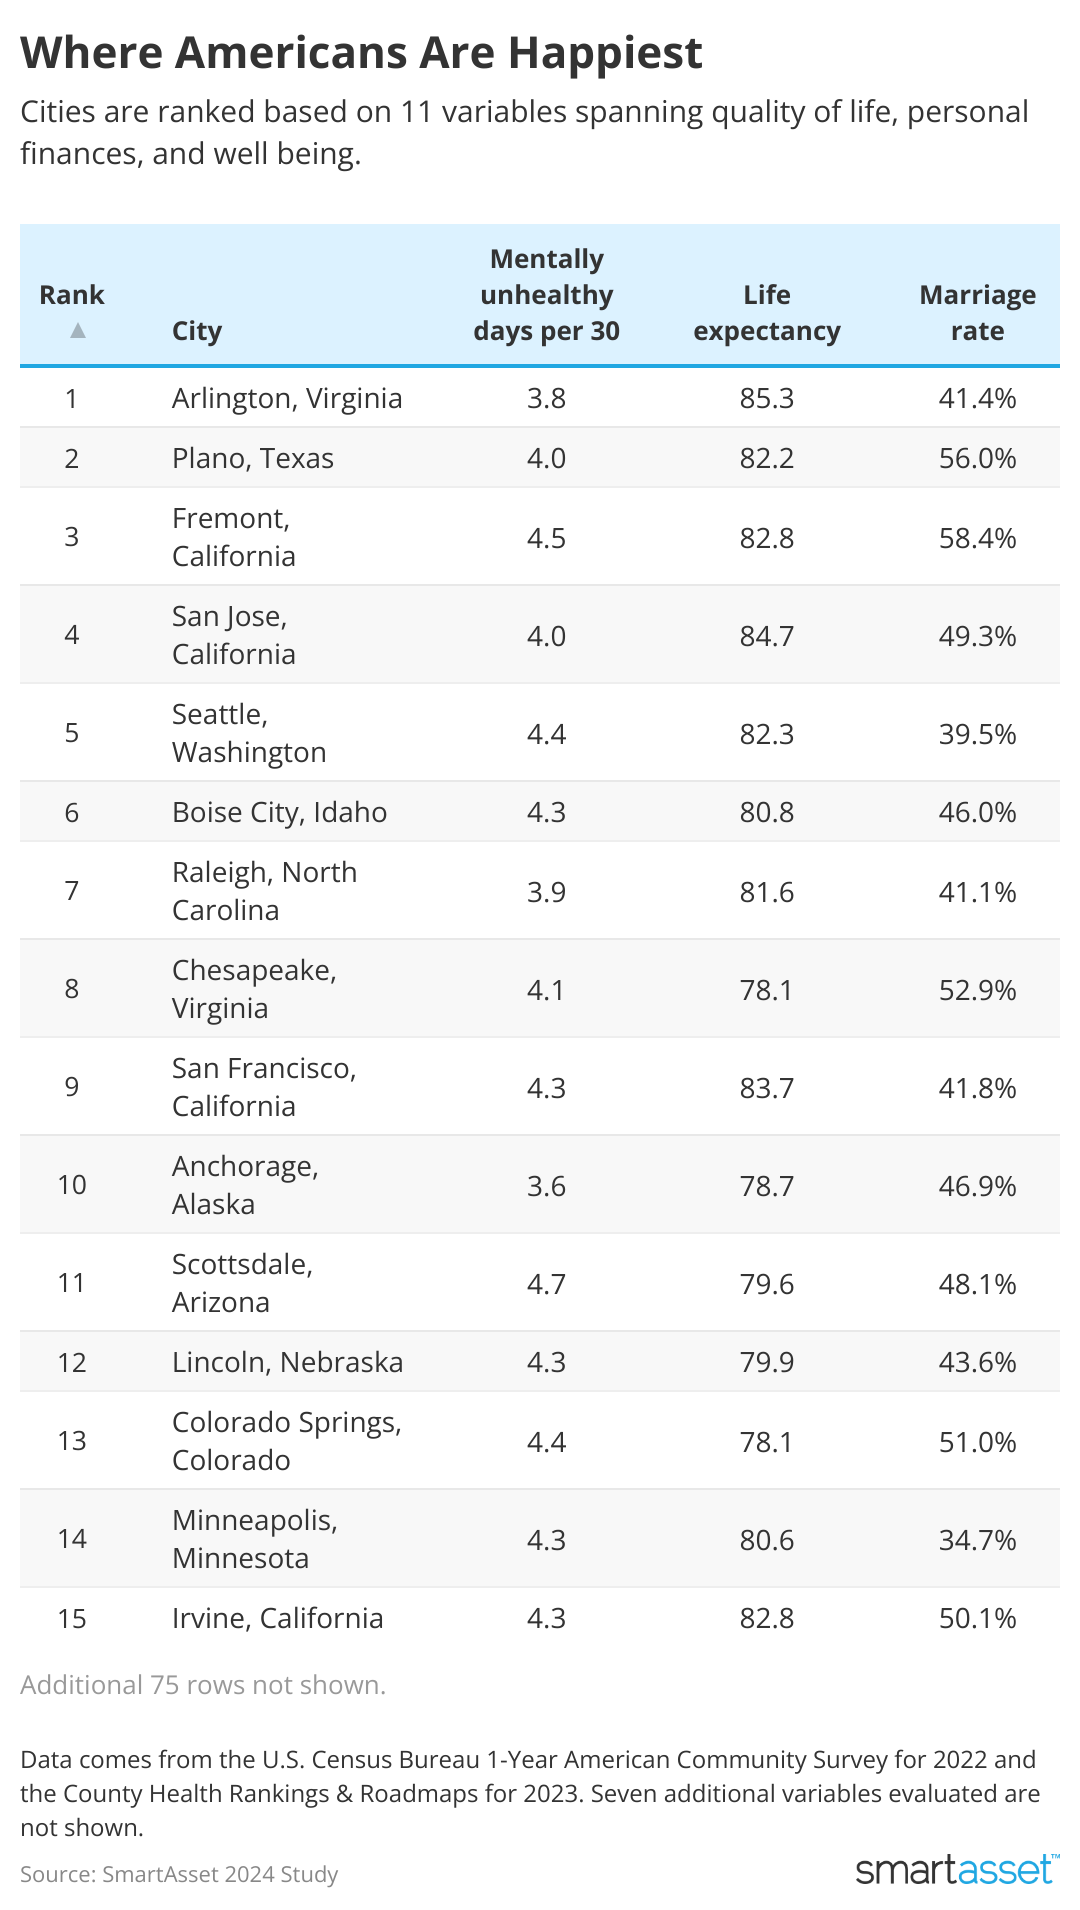
SmartAsset
Top 10 happiest cities
- Arlington, Virginia
- Percentage of households earning $100,000 or more: 62.8%
- Poverty rate: 6.5%
- Housing burdened: 13.3%
- Number of mentally unhealthy days per 30: 3.8
- Life expectancy: 85.3
- Population not getting physical activity: 14.4%
- Rate of health insurance coverage: 95.7%
- Marriage rate: 41.4%
- Traffic volume per meter of roadway: 2593.0
- Percentage of population with adequate space for physical activity: 100.0%
- Overcrowding rate: 3.3%
- Plano, Texas
- Percentage of households earning $100,000 or more: 52.5%
- Poverty rate: 4.9%
- Housing-cost burdened: 12.1%
- Number of mentally unhealthy days per 30: 3.9
- Life expectancy: 82.2
- Population not getting physical activity: 19.1%
- Rate of health insurance coverage: 89.5%
- Marriage rate: 56.0%
- Traffic volume per meter of roadway: 417
- Percentage of population with adequate space for physical activity: 92.4%
- Overcrowding rate: 2.4%
- Fremont, California
- Percentage of households earning $100,000 or more: 70.1%
- Poverty rate: 7.0%
- Housing-cost burdened: 17.2%
- Number of mentally unhealthy days per 30: 4.5
- Life expectancy: 82.8
- Population not getting physical activity: 17.9%
- Rate of health insurance coverage: 97.6%
- Marriage rate: 58.4%
- Traffic volume per meter of roadway: 1791
- Percentage of population with adequate space for physical activity: 99.4%
- Overcrowding rate: 7.9%
- San Jose, California
- Percentage of households earning $100,000 or more: 61.9%
- Poverty rate: 9.0%
- Housing-cost burdened: 15.6%
- Number of mentally unhealthy days per 30: 4.0
- Life expectancy: 84.7
- Population not getting physical activity: 18.5%
- Rate of health insurance coverage: 96.0%
- Marriage rate: 49.3%
- Traffic volume per meter of roadway: 1616
- Percentage of population with adequate space for physical activity: 99.5%
- Overcrowding rate: 8.2%
- Seattle, Washington
- Percentage of households earning $100,000 or more: 55.3%
- Poverty rate: 10.1%
- Housing-cost burdened: 14.6%
- Number of mentally unhealthy days per 30: 4.3
- Life expectancy: 82.3
- Population not getting physical activity: 13.9%
- Rate of health insurance coverage: 95.9%
- Marriage rate: 39.5%
- Traffic volume per meter of roadway: 1309
- Percentage of population with adequate space for physical activity: 98.0%
- Overcrowding rate: 3.8%
- Boise, Idaho
- Percentage of households earning $100,000 or more: 39.0%
- Poverty rate: 11.1%
- Housing-cost burdened: 0.105348873
- Number of mentally unhealthy days per 30: 4.2
- Life expectancy: 80.8
- Population not getting physical activity: 17.2%
- Rate of health insurance coverage: 93.7%
- Marriage rate: 46.0%
- Traffic volume per meter of roadway: 315
- Percentage of population with adequate space for physical activity: 86.0%
- Overcrowding rate: 1.6%
- Raleigh, North Carolina
- Percentage of households earning $100,000 or more: 38.4%
- Poverty rate: 11.0%
- Housing-cost burdened: 11.2%
- Number of mentally unhealthy days per 30: 3.9
- Life expectancy: 81.6
- Population not getting physical activity: 16.2%
- Rate of health insurance coverage: 90.3%
- Marriage rate: 41.1%
- Traffic volume per meter of roadway: 545
- Percentage of population with adequate space for physical activity: 89.6%
- Overcrowding rate: 2.0%
- Chesapeake, Virginia
- Percentage of households earning $100,000 or more: 43.5%
- Poverty rate: 8.4%
- Housing-cost burdened: 12.6%
- Number of mentally unhealthy days per 30: 4.0
- Life expectancy: 78.1
- Population not getting physical activity: 22.3%
- Rate of health insurance coverage: 93.5%
- Marriage rate: 52.9%
- Traffic volume per meter of roadway: 526
- Percentage of population with adequate space for physical activity: 90.6%
- Overcrowding rate: 1.4%
- San Francisco, California
- Percentage of households earning $100,000 or more: 60.4%
- Poverty rate: 10.4%
- Housing-cost burdened: 16.3%
- Number of mentally unhealthy days per 30: 4.2
- Life expectancy: 83.7
- Population not getting physical activity: 16.9%
- Rate of health insurance coverage: 97.0%
- Marriage rate: 41.8%
- Traffic volume per meter of roadway: 2397
- Percentage of population with adequate space for physical activity: 100.0%
- Overcrowding rate: 6.6%
- Anchorage, Alaska
- Percentage of households earning $100,000 or more: 50.5%
- Poverty rate: 11.1%
- Housing-cost burdened: 12.7%
- Number of mentally unhealthy days per 30: 3.6
- Life expectancy: 78.7
- Population not getting physical activity: 19.5%
- Rate of health insurance coverage: 90.4%
- Marriage rate: 46.9%
- Traffic volume per meter of roadway: 534
- Percentage of population with adequate space for physical activity: 91.0%
- Overcrowding rate: 4.7%
10 least happy cities
- Detroit, Michigan
- Percentage of households earning $100,000 or more: 12.7%
- Poverty rate: 33.8%
- Housing-cost burdened: 16.4%
- Number of mentally unhealthy days per 30: 5.6
- Life expectancy: 74
- Population not getting physical activity: 24.7%
- Rate of health insurance coverage: 93.4%
- Marriage rate: 21%
- Traffic volume per meter of roadway: 1627.9
- Percentage of population with adequate space for physical activity: 95.5%
- Overcrowding rate: 2.1%
- Laredo, Texas
- Percentage of households earning $100,000 or more: 26.4%
- Poverty rate: 20.1%
- Housing-cost burdened: 15.0%
- Number of mentally unhealthy days per 30: 4.7
- Life expectancy: 79
- Population not getting physical activity: 38.0%
- Rate of health insurance coverage: 74.2%
- Marriage rate: 47.3%
- Traffic volume per meter of roadway: 559.3
- Percentage of population with adequate space for physical activity: 91.0%
- Overcrowding rate: 11.5%
- New Orleans, Louisiana
- Percentage of households earning $100,000 or more: 28.1%
- Poverty rate: 22.2%
- Housing-cost burdened: 25.6%
- Number of mentally unhealthy days per 30: 5.9
- Life expectancy: 76
- Population not getting physical activity: 27.4%
- Rate of health insurance coverage: 93.5%
- Marriage rate: 32.9%
- Traffic volume per meter of roadway: 2109.3
- Percentage of population with adequate space for physical activity: 94.9%
- Overcrowding rate: 1.4%
- Newark, New Jersey
- Percentage of households earning $100,000 or more: 21.6%
- Poverty rate: 24.0%
- Housing-cost burdened: 23.2%
- Number of mentally unhealthy days per 30: 4.92
- Life expectancy: 78
- Population not getting physical activity: 25.5%
- Rate of health insurance coverage: 83.7%
- Marriage rate: 32.8%
- Traffic volume per meter of roadway: 1493.9
- Percentage of population with adequate space for physical activity: 99.7%
- Overcrowding rate: 4.6%
- Memphis, Tennessee
- Percentage of households earning $100,000 or more: 22.5%
- Poverty rate: 21.4%
- Housing-cost burdened: 17.7%
- Number of mentally unhealthy days per 30: 5.2
- Life expectancy: 74
- Population not getting physical activity: 26.1%
- Rate of health insurance coverage: 87.2%
- Marriage rate: 30.7%
- Traffic volume per meter of roadway: 523.1
- Percentage of population with adequate space for physical activity: 86.3%
- Overcrowding rate: 2.2%
- Philadelphia, Pennsylvania
- Percentage of households earning $100,000 or more: 27.7%
- Poverty rate: 21.7%
- Housing-cost burdened: 20.6%
- Number of mentally unhealthy days per 30: 5.5
- Life expectancy: 75
- Population not getting physical activity: 29.7%
- Rate of health insurance coverage: 93.2%
- Marriage rate: 33%
- Traffic volume per meter of roadway: 1635.4
- Percentage of population with adequate space for physical activity: 100%
- Overcrowding rate: 2.7%
- Miami, Florida
- Percentage of households earning $100,000 or more: 30.7%
- Poverty rate: 18.7%
- Housing-cost burdened: 25.1%
- Number of mentally unhealthy days per 30: 4.4
- Life expectancy: 82
- Population not getting physical activity: 33.2%
- Rate of health insurance coverage: 82.6%
- Marriage rate: 35%
- Traffic volume per meter of roadway: 1458.8
- Percentage of population with adequate space for physical activity: 98.4%
- Overcrowding rate: 6.3%
- El Paso, Texas
- Percentage of households earning $100,000 or more: 22.5%
- Poverty rate: 21.7%
- Housing-cost burdened: 14.6%
- Number of mentally unhealthy days per 30: 4.8
- Life expectancy: 78
- Population not getting physical activity: 30.3%
- Rate of health insurance coverage: 79.2%
- Marriage rate: 44.4%
- Traffic volume per meter of roadway: 632.0
- Percentage of population with adequate space for physical activity: 81.7%
- Overcrowding rate: 5.0%
- Cleveland, Ohio
- Percentage of households earning $100,000 or more: 14.0%
- Poverty rate: 31.8%
- Housing-cost burdened: 14.8%
- Number of mentally unhealthy days per 30: 5.4
- Life expectancy: 76
- Population not getting physical activity: 23.1%
- Rate of health insurance coverage: 92.7%
- Marriage rate: 24.4%
- Traffic volume per meter of roadway: 677.5
- Percentage of population with adequate space for physical activity: 98.0%
- Overcrowding rate: 1.1%
- Houston, Texas
- Percentage of households earning $100,000 or more: 28.5%
- Poverty rate: 20.7%
- Housing-cost burdened: 16.2%
- Number of mentally unhealthy days per 30: 4.5
- Life expectancy: 79
- Population not getting physical activity: 28.7%
- Rate of health insurance coverage: 75.9%
- Marriage rate: 39.4%
- Traffic volume per meter of roadway: 808.9
- Percentage of population with adequate space for physical activity: 90.9%
- Overcrowding rate: 5.6%
Data and methodology
90 of the largest U.S. cities for which data was available were evaluated across three categories: personal finance, well being, and quality of life. Data comes from the U.S. Census Bureau 1-Year American Community Survey for 2022 and the County Health Rankings & Roadmaps for 2023.
Personal finance metrics included:
- Percent of individuals earnings $100,000 or more.
- Percent of households that spend 50% or more of income on housing.
- Percent of residents below the poverty level.
Well-being:
- Average number of mentally unhealthy days in the last 30.
- Life expectancy in years.
- Percent of residents who report being physically inactive.
- Percent of residents who have health insurance.
Quality of Life:
- Marriage rate.
- Average traffic volume per meter of major roadways in the county.
- Percent of population with adequate access to locations for physical activity.
- Percentage of households with overcrowding (more than one person living in a room).
This story was produced by SmartAsset and reviewed and distributed by Stacker Media.

Originally published on smartasset.com, part of the BLOX Digital Content Exchange.
Tags
Post a comment as anonymous
Report
Watch this discussion. Stop watching this discussion.
Latest News
- California prison towns grasp for new jobs after closures: ‘No one is coming to save us’
- World No. 3 Pegula beats defending champ Swiatek to reach Cincy final
- IndyCars zip among iconic Washington landmarks ahead of Freedom 250
- Bozeman Renaissance Fair Brings Costumes And Crowds To Gallatin County Fairgrounds
- Wyndham Clark surges clear at BMW Championship
- ‘Got to play the game’: Missouri doctors group jumps into state politics with $1.5M PAC investment
- Texas Soldiers who died of disease during Civil War honored in Southwest Arkansas
- Sparks wins Moody XC Invitational; Lady Pirates 3rd overall


(0) comments
Welcome to the discussion.
Log In
Keep it Clean. Please avoid obscene, vulgar, lewd, racist or sexually-oriented language.
PLEASE TURN OFF YOUR CAPS LOCK.
Don't Threaten. Threats of harming another person will not be tolerated.
Be Truthful. Don't knowingly lie about anyone or anything.
Be Nice. No racism, sexism or any sort of -ism that is degrading to another person.
Be Proactive. Use the 'Report' link on each comment to let us know of abusive posts.
Share with Us. We'd love to hear eyewitness accounts, the history behind an article.