The 25 most dangerous cities for drivers
- CarInsuranceCompanies.com
- 0
The likelihood of getting into any car accident is higher in urban areas, but the likelihood of being involved in a fatal accident is higher in rural areas.
Intro
Updated

Photo Credit: Alamy Stock Photo
Driving is a way of life for most Americans. Data from the U.S. Census Bureau shows that there are more than 120 million vehicles used for commuting, and research conducted by Gallup found that 83 percent of adults drive at least several times per week. Even though driving is one of the most popular modes of transportation, it’s not without risk.
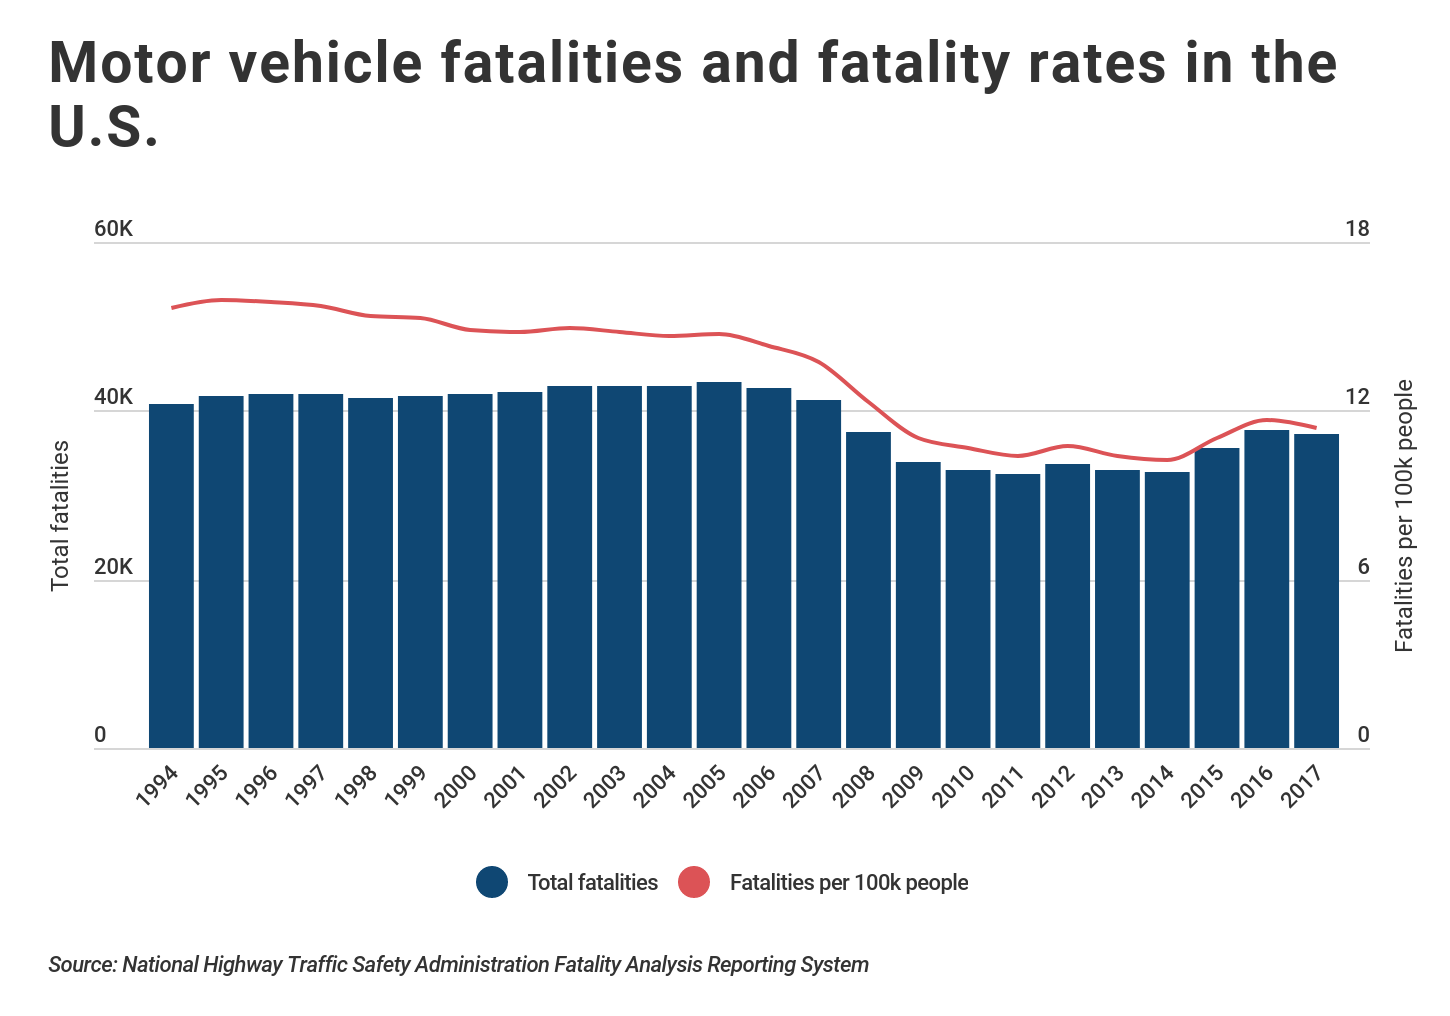
Research from the National Highway Traffic Safety Administration (NHTSA) shows that in 2017, driving was responsible for 37,133 fatalities. Adjusted for population, that’s 11.4 driving fatalities for every 100,000 people in the U.S.
Driving has long been a leading cause of death among teens—young drivers have less experience and are more likely to engage in risky driving behavior. There has been a slight rise in traffic fatalities over the past five years, but the longer term trend shows that fewer people are dying as a result of car accidents.

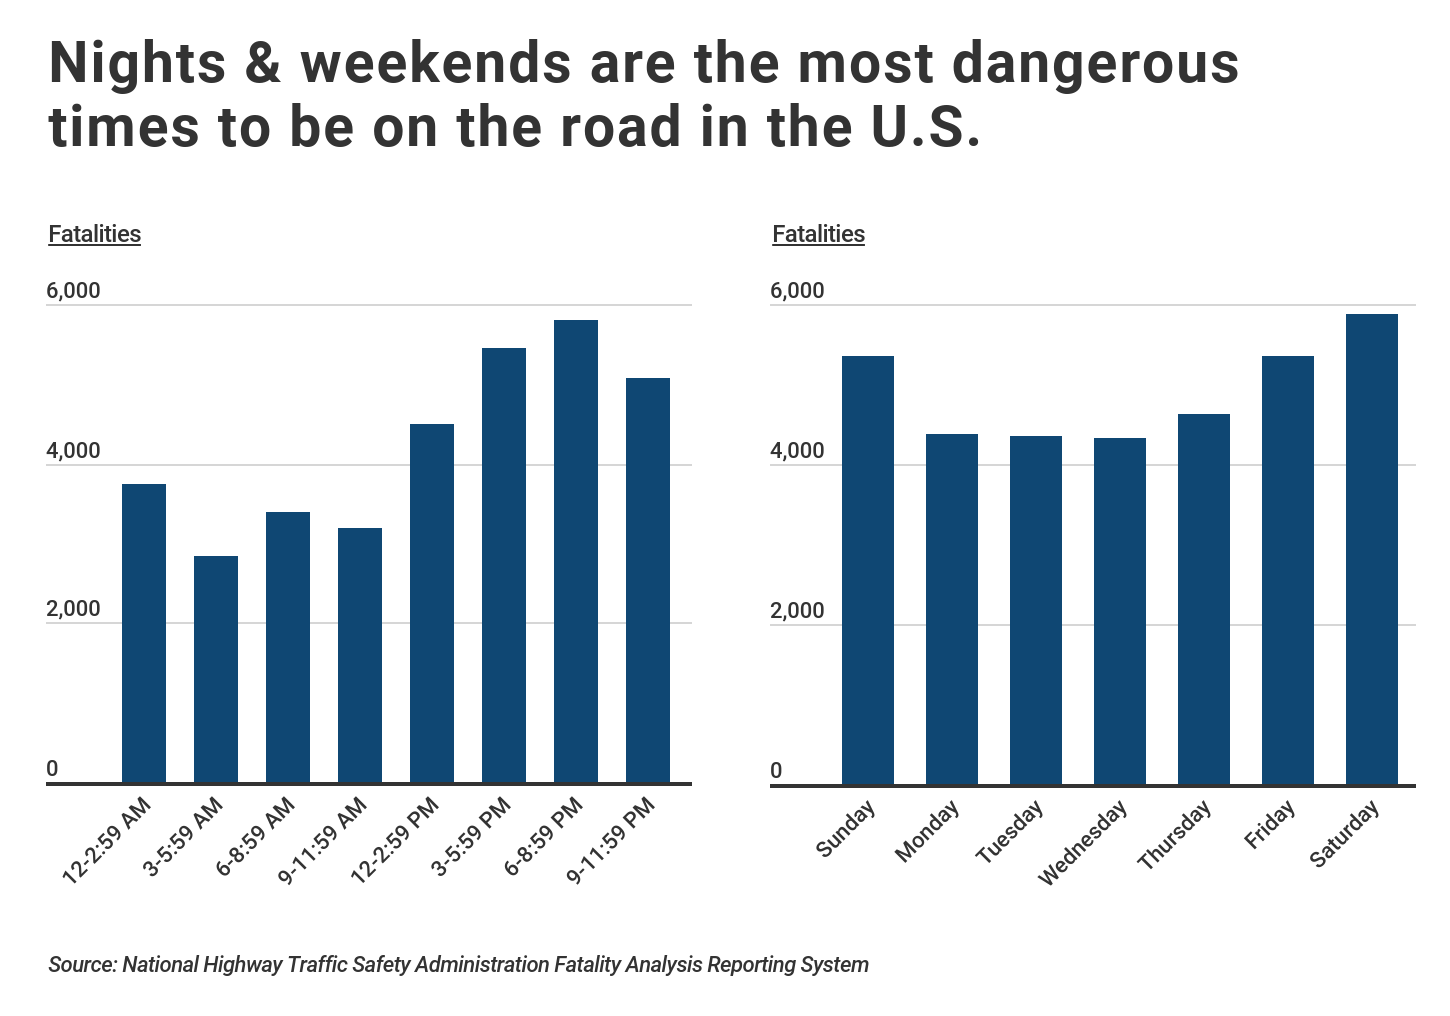
Despite safety improvements over the past 25 years, certain times of the day and week are still more dangerous than others for drivers. Car accidents can occur at any time, but data from the NHTSA shows that fatal accidents are more likely to occur on nights and weekends. In 2017, there were 70 percent more fatal accidents between 6-9 PM than between 6-9 AM. Likewise, compared to Monday-Thursday, Friday-Sunday saw 25 percent more fatal crashes per day.

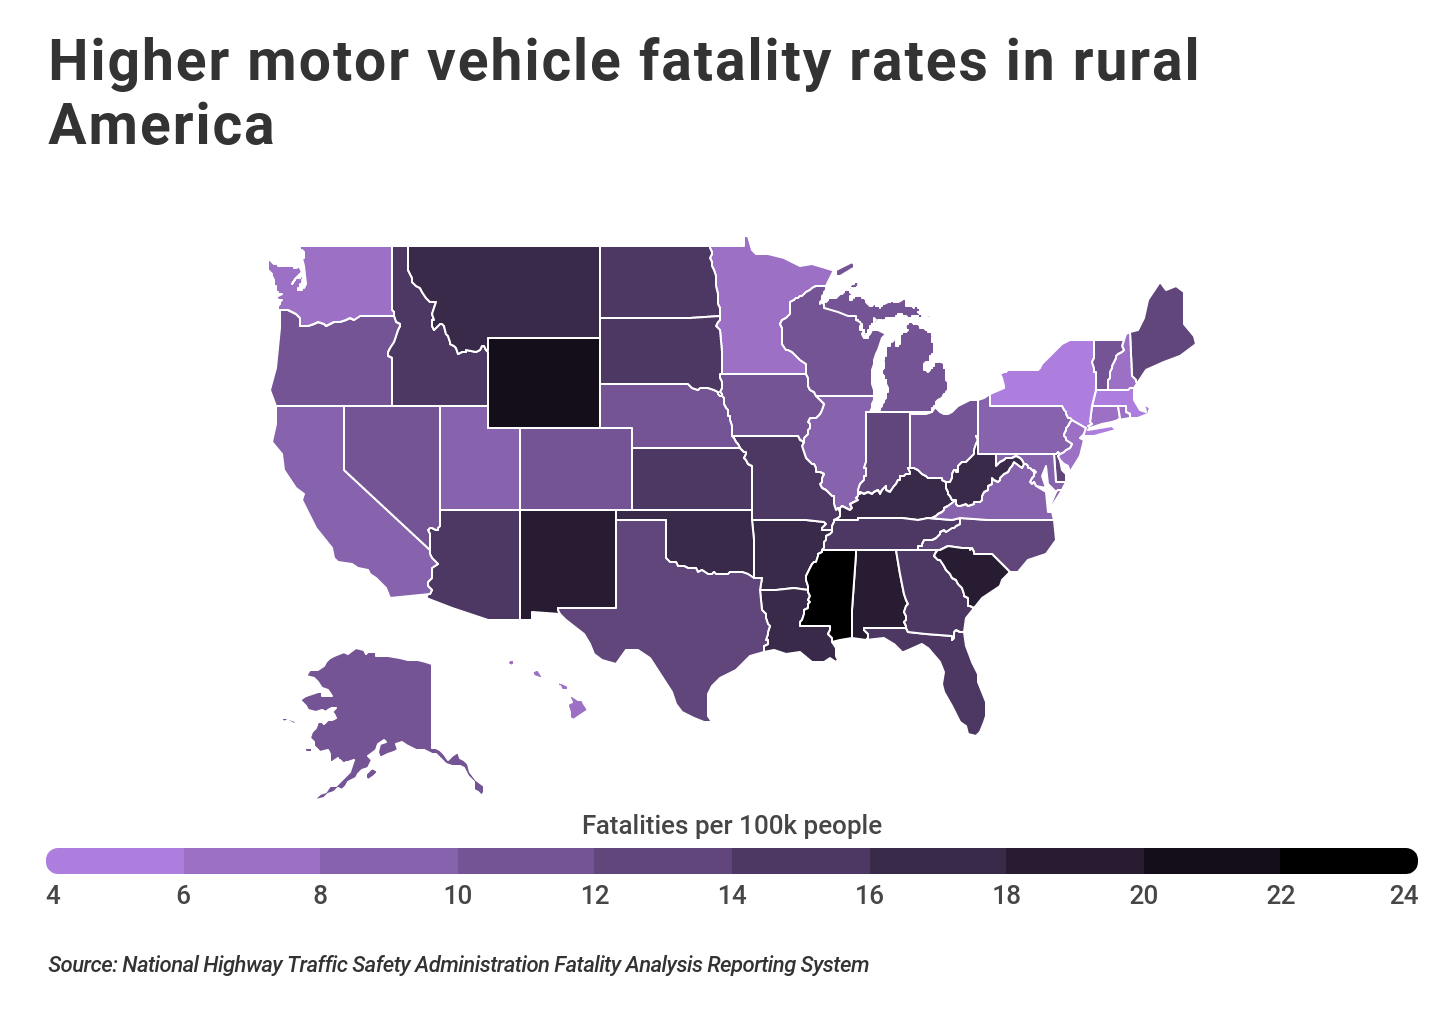
Timing is not the only factor that influences traffic fatalities; location matters too. The likelihood of getting into any car accident is higher in urban areas, but the likelihood of being involved in a fatal accident is higher in rural areas. According to the IIHS, only 19 percent of Americans live in rural areas and 30 percent of the miles traveled by vehicles occur in rural areas, but almost half of traffic fatalities happen in these locations. Within rural areas, crash deaths are also more likely to occur on local and collector roads rather than on interstates.

According to the Federal Highway Administration, rural collector roads and local roads may not be fully paved or have clearly delineated directions of travel, increasing the likelihood of collision. In addition, the speed limit on rural roads is usually higher than on urban roads, and crashes that occur at higher speeds can be more severe. These factors are compounded by limited (or delayed) access to health care services in many rural areas.
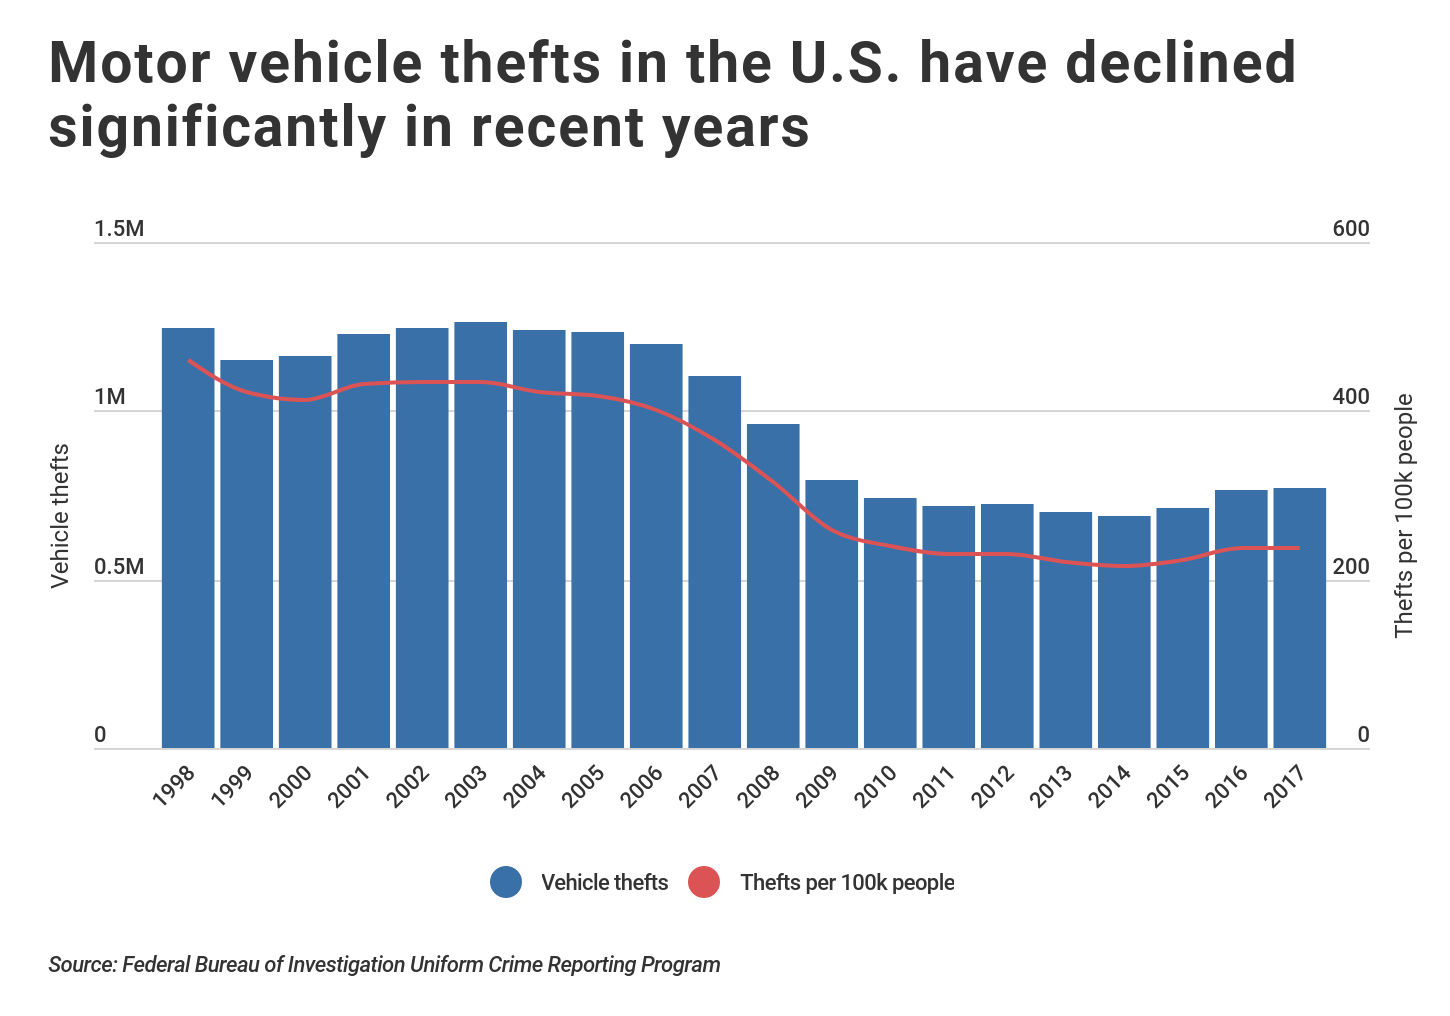
Collisions aren’t the only danger for drivers. Cars are also subject to theft—a crime that cost Americans about $6 billion in 2017. The good news is that vehicle thefts have also been trending down over the past two decades. In 2017, the number of vehicle thefts nationwide was about a third lower than what it was in 1998 and the rate of vehicle thefts per 100,000 people was nearly halved.

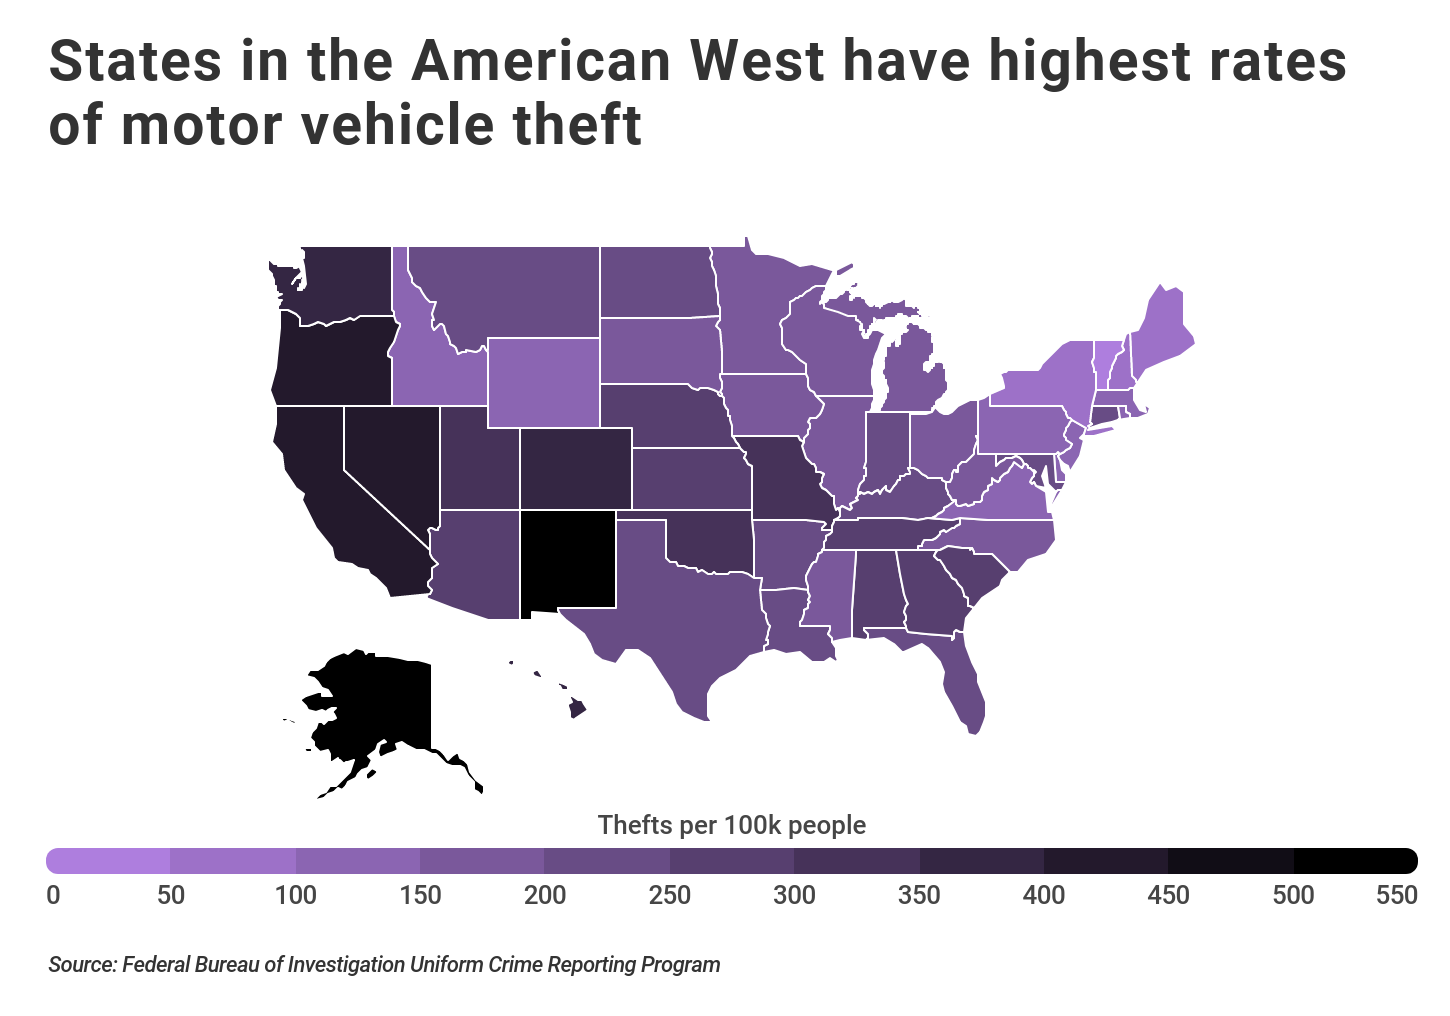
Similar to motor vehicle accidents and fatalities, location is a big determinant in the likelihood of having a car stolen. Most car thefts occur in Western states, such as New Mexico, Nevada, and California. By contrast, states in the Northeast, such as Vermont, Maine, and New York, tend to have lower rates of motor vehicle theft.

When considering the likelihood of collision, traffic fatalities, motor vehicle thefts, and inclement weather, some cities are more dangerous for drivers than others. To identify the most dangerous cities for drivers, researchers at CarInsuranceCompanies.com used data from the National Highway Traffic Safety Administration Fatality Analysis Reporting System, Allstate’s America’s Best Drivers Report, the Federal Bureau of Investigation Uniform Crime Reporting Program, and the National Centers for Environmental Information Comparative Climatic Data to create a composite score for each of the largest U.S. cities based on the following factors:
- Motor vehicle fatality rate (50%)
- Relative collision likelihood (30%)
- Motor vehicle theft rate (10%)
- Annual days with precipitation (10%)
Only the 183 most populous cities in the U.S. with available data from all of the sources were included. Here’s what the study found:
Key takeaways
Updated- Nationwide there were 37,133 fatalities in 2017, resulting in a fatality rate of 11.4 per 100,000 people. Among major cities, that number ranges from a low of 0.6 in Cary, NC to a high of 27.9 in Charleston, SC.
- Across the entire U.S., the average driver experiences a collision once every 10.6 years. That ranges from a high of 14.9 in Brownsville, TX to a low of 4.2 in Baltimore, MD.
- According to data from the FBI, there were over 770,000 reported motor vehicle thefts in 2017, or 237 per 100,000 people. The car theft rate ranges from 31.6 in Naperville, IL to over 1,375 in Albuquerque, NM.
- Several cities in the South, Midwest, and California are among the most dangerous 25 cities for drivers. More specifically, four cities from the list are from California, four are from Florida, and four are from Texas.
25. Orlando, FL
Updated
Photo Credit: Alamy Stock Photo
- Motor vehicle fatalities: 13.2 per 100k people (37 per year)
- Relative collision likelihood: 15.3% above average
- Motor vehicle thefts: 495 per 100k people (1,387 per year)
- Annual days with precipitation: 117
- Population: 280,258
24. Fresno, CA
Updated
Photo Credit: Alamy Stock Photo
- Motor vehicle fatalities: 11.6 per 100k people (61 per year)
- Relative collision likelihood: 31.9% above average
- Motor vehicle thefts: 529 per 100k people (2,789 per year)
- Annual days with precipitation: 45
- Population: 527,422
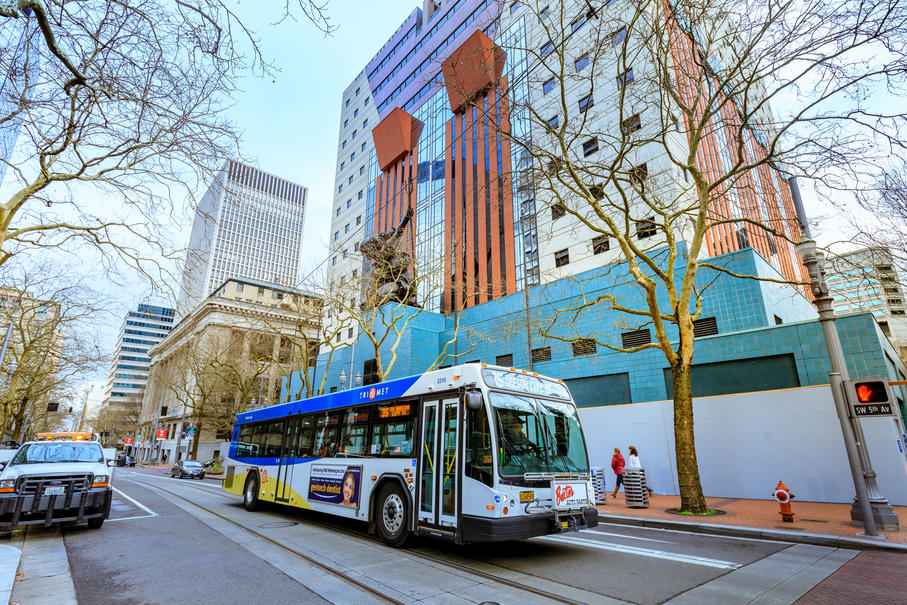
23. Portland, OR
Updated
Photo Credit: Alamy Stock Photo
- Motor vehicle fatalities: 7.4 per 100k people (48 per year)
- Relative collision likelihood: 51.0% above average
- Motor vehicle thefts: 1,126 per 100k people (7,295 per year)
- Annual days with precipitation: 153
- Population: 648,121
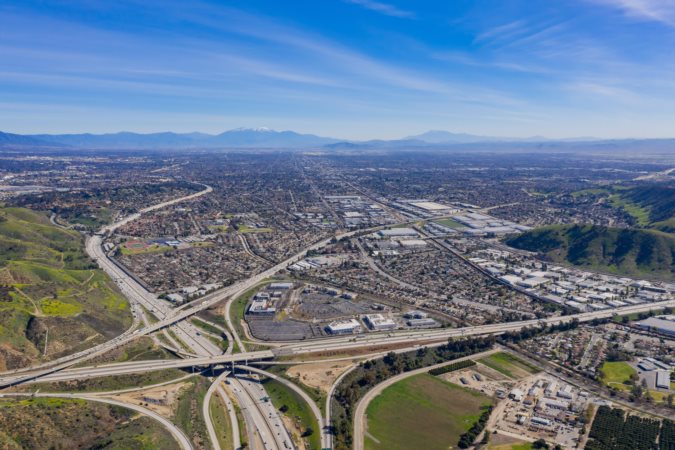
22. San Bernardino, CA
Updated
Photo Credit: Alamy Stock Photo
- Motor vehicle fatalities: 10.1 per 100k people (22 per year)
- Relative collision likelihood: 41.8% above average
- Motor vehicle thefts: 1,049 per 100k people (2,277 per year)
- Annual days with precipitation: 38
- Population: 216,983
21. Fort Worth, TX
Updated
Photo Credit: Alamy Stock Photo
- Motor vehicle fatalities: 12.6 per 100k people (110 per year)
- Relative collision likelihood: 29.7% above average
- Motor vehicle thefts: 309 per 100k people (2,706 per year)
- Annual days with precipitation: 79
- Population: 876,060
20. Cincinnati, OH
Updated
Photo Credit: Alamy Stock Photo
- Motor vehicle fatalities: 8.6 per 100k people (26 per year)
- Relative collision likelihood: 47.6% above average
- Motor vehicle thefts: 493 per 100k people (1,485 per year)
- Annual days with precipitation: 132
- Population: 301,305
19. Houston, TX
Updated
Photo Credit: Alamy Stock Photo
- Motor vehicle fatalities: 10.6 per 100k people (245 per year)
- Relative collision likelihood: 38.0% above average
- Motor vehicle thefts: 501 per 100k people (11,596 per year)
- Annual days with precipitation: 103
- Population: 2,313,230
18. Pomona, CA
Updated
Photo Credit: Alamy Stock Photo
- Motor vehicle fatalities: 11.8 per 100k people (18 per year)
- Relative collision likelihood: 34.0% above average
- Motor vehicle thefts: 817 per 100k people (1,250 per year)
- Annual days with precipitation: 27
- Population: 152,946
17. Hollywood, FL
Updated
Photo Credit: Alamy Stock Photo
- Motor vehicle fatalities: 14.3 per 100k people (22 per year)
- Relative collision likelihood: 14.9% above average
- Motor vehicle thefts: 329 per 100k people (505 per year)
- Annual days with precipitation: 145
- Population: 153,625
16. Mesquite, TX
Updated
Photo Credit: Alamy Stock Photo
- Motor vehicle fatalities: 11.1 per 100k people (16 per year)
- Relative collision likelihood: 38.4% above average
- Motor vehicle thefts: 590 per 100k people (849 per year)
- Annual days with precipitation: 79
- Population: 143,822
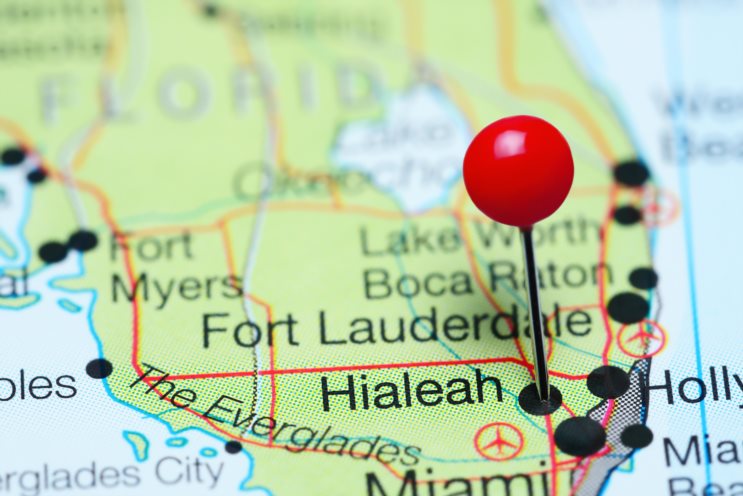
15. Hialeah, FL
Updated
Photo Credit: Alamy Stock Photo
- Motor vehicle fatalities: 12.5 per 100k people (30 per year)
- Relative collision likelihood: 26.0% above average
- Motor vehicle thefts: 286 per 100k people (685 per year)
- Annual days with precipitation: 138
- Population: 239,682
14. Fort Lauderdale, FL
Updated
Photo Credit: Alamy Stock Photo
- Motor vehicle fatalities: 16.7 per 100k people (30 per year)
- Relative collision likelihood: 6.8% above average
- Motor vehicle thefts: 514 per 100k people (925 per year)
- Annual days with precipitation: 145
- Population: 180,071
13. Charlotte, NC
Updated
Photo Credit: Alamy Stock Photo
- Motor vehicle fatalities: 12.0 per 100k people (103 per year)
- Relative collision likelihood: 35.9% above average
- Motor vehicle thefts: 305 per 100k people (2,622 per year)
- Annual days with precipitation: 112
- Population: 859,052
12. Memphis, TN
Updated
Photo Credit: Alamy Stock Photo
- Motor vehicle fatalities: 15.2 per 100k people (99 per year)
- Relative collision likelihood: 16.8% above average
- Motor vehicle thefts: 614 per 100k people (4,002 per year)
- Annual days with precipitation: 108
- Population: 652,231
11. Springfield, MA
Updated
Photo Credit: Alamy Stock Photo
- Motor vehicle fatalities: 11.0 per 100k people (17 per year)
- Relative collision likelihood: 81.7% above average
- Motor vehicle thefts: 329 per 100k people (509 per year)
- Annual days with precipitation: 100
- Population: 154,763
10. Louisville, KY
Updated
Photo Credit: Alamy Stock Photo
- Motor vehicle fatalities: 14.3 per 100k people (89 per year)
- Relative collision likelihood: 16.2% above average
- Motor vehicle thefts: 622 per 100k people (3,864 per year)
- Annual days with precipitation: 124
- Population: 621,337
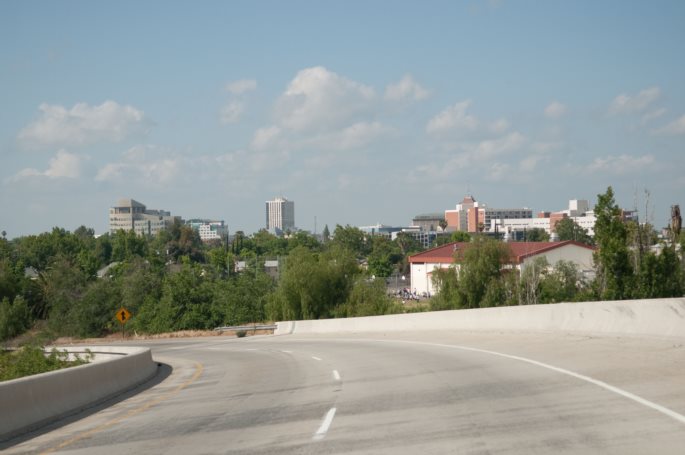
9. Sacramento, CA
Updated
Photo Credit: Alamy Stock Photo
- Motor vehicle fatalities: 13.7 per 100k people (69 per year)
- Relative collision likelihood: 40.0% above average
- Motor vehicle thefts: 542 per 100k people (2,718 per year)
- Annual days with precipitation: 57
- Population: 501,890
8. Cleveland, OH
Updated
Photo Credit: Alamy Stock Photo
- Motor vehicle fatalities: 13.7 per 100k people (53 per year)
- Relative collision likelihood: 18.9% above average
- Motor vehicle thefts: 881 per 100k people (3,395 per year)
- Annual days with precipitation: 156
- Population: 385,552
7. New Orleans, LA
Updated
Photo Credit: Alamy Stock Photo
- Motor vehicle fatalities: 11.2 per 100k people (44 per year)
- Relative collision likelihood: 49.1% above average
- Motor vehicle thefts: 644 per 100k people (2,531 per year)
- Annual days with precipitation: 114
- Population: 393,292
6. Atlanta, GA
Updated
Photo Credit: Alamy Stock Photo
- Motor vehicle fatalities: 11.3 per 100k people (55 per year)
- Relative collision likelihood: 49.4% above average
- Motor vehicle thefts: 678 per 100k people (3,297 per year)
- Annual days with precipitation: 115
- Population: 486,299
5. St. Louis, MO
Updated
Photo Credit: Alamy Stock Photo
- Motor vehicle fatalities: 18.1 per 100k people (56 per year)
- Relative collision likelihood: 22.4% above average
- Motor vehicle thefts: 879 per 100k people (2,713 per year)
- Annual days with precipitation: 110
- Population: 308,626
4. Detroit, MI
Updated
Photo Credit: Alamy Stock Photo
- Motor vehicle fatalities: 15.3 per 100k people (103 per year)
- Relative collision likelihood: 22.8% above average
- Motor vehicle thefts: 1,212 per 100k people (8,155 per year)
- Annual days with precipitation: 135
- Population: 673,103
3. Dallas, TX
Updated
Photo Credit: Alamy Stock Photo
- Motor vehicle fatalities: 14.5 per 100k people (194 per year)
- Relative collision likelihood: 46.5% above average
- Motor vehicle thefts: 590 per 100k people (7,913 per year)
- Annual days with precipitation: 79
- Population: 1,341,103
2. Savannah, GA
Updated
Photo Credit: Alamy Stock Photo
- Motor vehicle fatalities: 15.7 per 100k people (23 per year)
- Relative collision likelihood: 37.8% above average
- Motor vehicle thefts: 642 per 100k people (940 per year)
- Annual days with precipitation: 110
- Population: 146,449
1. Baton Rouge, LA
Updated
Photo Credit: Alamy Stock Photo
- Motor vehicle fatalities: 23.1 per 100k people (52 per year)
- Relative collision likelihood: 55.1% above average
- Motor vehicle thefts: 440 per 100k people (991 per year)
- Annual days with precipitation: 113
- Population: 225,370
Methodology
UpdatedTo identify the most dangerous cities for drivers, a composite score was calculated based on the following factors:
- Motor vehicle fatality rate (50%)
- Relative collision likelihood (30%)
- Motor vehicle theft rate (10%)
- Annual days with precipitation (10%)
Using data from:
- Annual motor vehicle fatalities are from the National Highway Traffic Safety Administration Fatality Analysis Reporting System
- Collision rates are from Allstate’s America’s Best Drivers Report
- Annual motor vehicle thefts are from the Federal Bureau of Investigation Uniform Crime Reporting Program
- Annual days with precipitation are from the National Centers for Environmental Information Comparative Climatic Data
Only the 200 most populous cities in the U.S. were included in the analysis. Of those 200 cities, 17 were removed because of missing data across one or multiple data sources. For a complete set of results for all cities, see the original version on CarInsuranceCompanies.com.
Originally published on carinsurancecompanies.com, part of the BLOX Digital Content Exchange.
Post a comment as anonymous
Report
Watch this discussion. Stop watching this discussion.
Latest News
- Hub Group, Inc. Sued for Securities Law Violations - Contact the DJS Law Group to Discuss Your Rights - HUBG
- Futu Holdings Limited Investor Alert: Contact SBS by August 25, 2026 for Opportunity to Lead Securities Fraud Lawsuit
- First Solar, Inc. Sued for Securities Law Violations - Contact the DJS Law Group to Discuss Your Rights - FSLR
- Peabody Energy Corporation Investor Alert: Contact SBS by August 24, 2026 for Opportunity to Lead Securities Fraud Lawsuit
- Peabody Energy Corporation Sued for Securities Law Violations - Contact the DJS Law Group to Discuss Your Rights - BTU
- 'I'll adapt': First pregnant candidate navigates French presidential race
- China, Indonesia hold talks on security, defence
- Akeso's AK157D1 (B7-H3 ADC) Cleared for Phase I Trial in Solid Tumors, Adding a Third Differentiated ADC to Its Pipeline

(0) comments
Welcome to the discussion.
Log In
Keep it Clean. Please avoid obscene, vulgar, lewd, racist or sexually-oriented language.
PLEASE TURN OFF YOUR CAPS LOCK.
Don't Threaten. Threats of harming another person will not be tolerated.
Be Truthful. Don't knowingly lie about anyone or anything.
Be Nice. No racism, sexism or any sort of -ism that is degrading to another person.
Be Proactive. Use the 'Report' link on each comment to let us know of abusive posts.
Share with Us. We'd love to hear eyewitness accounts, the history behind an article.