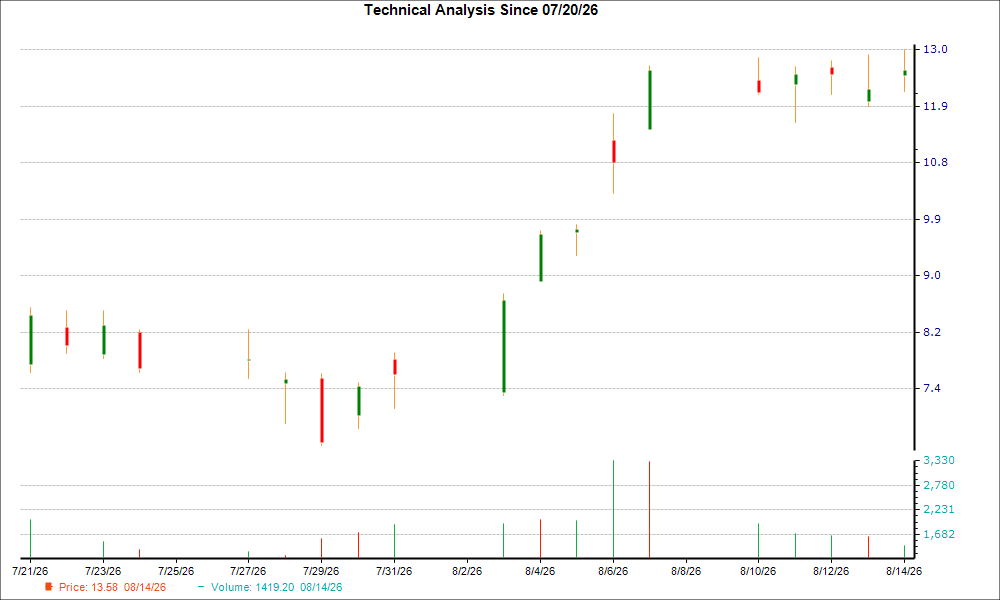
A downtrend has been apparent in Redwire Corporation (RDW) lately. While the stock has lost 8.1% over the past week, it could witness a trend reversal as a hammer chart pattern was formed in its last trading session. This could mean that the bulls have been able to counteract the bears to help the stock find support.
The formation of a hammer pattern is considered a technical indication of nearing a bottom with likely subsiding of selling pressure. But this is not the only factor that makes a bullish case for the stock. On the fundamental side, strong agreement among Wall Street analysts in raising earnings estimates for this company enhances its prospects of a trend reversal.
What is a Hammer Chart and How to Trade It?
This is one of the popular price patterns in candlestick charting. A minor difference between the opening and closing prices forms a small candle body, and a higher difference between the low of the day and the open or close forms a long lower wick (or vertical line). The length of the lower wick being at least twice the length of the real body, the candle resembles a 'hammer.'
In simple terms, during a downtrend, with bears having absolute control, a stock usually opens lower compared to the previous day's close, and again closes lower. On the day the hammer pattern is formed, maintaining the downtrend, the stock makes a new low. However, after eventually finding support at the low of the day, some amount of buying interest emerges, pushing the stock up to close the session near or slightly above its opening price.
When it occurs at the bottom of a downtrend, this pattern signals that the bears might have lost control over the price. And, the success of bulls in stopping the price from falling further indicates a potential trend reversal.
Hammer candles can occur on any timeframe -- such as one-minute, daily, weekly -- and are utilized by both short-term as well as long-term investors.
Like every technical indicator, the hammer chart pattern has its limitations. Particularly, as the strength of a hammer depends on its placement on the chart, it should always be used in conjunction with other bullish indicators.
Here's What Makes the Trend Reversal More Likely for RDW
There has been an upward trend in earnings estimate revisions for RDW lately, which can certainly be considered a bullish indicator on the fundamental side. That's because a positive trend in earnings estimate revisions usually translates into price appreciation in the near term.
Over the last 30 days, the consensus EPS estimate for the current year has increased 16.1%. What it means is that the sell-side analysts covering RDW are majorly in agreement that the company will report better earnings than they predicted earlier.
If this is not enough, you should note that RDW currently has a Zacks Rank #2 (Buy), which means it is in the top 20% of more than 4,000 stocks that we rank based on trends in earnings estimate revisions and EPS surprises. And stocks carrying a Zacks Rank #1 or 2 usually outperform the market. You can see the complete list of today's Zacks Rank #1 (Strong Buy) stocks here >>>> .
Moreover, a Zacks Rank of 2 for Redwire Corporation is a more conclusive indication of a potential trend reversal, as the Zacks Rank has proven to be an excellent timing indicator that helps investors identify precisely when a company's prospects are beginning to improve.
7 Best Stocks for the Next 30 Days
Just released: Experts distill 7 elite stocks from the current list of 220 Zacks Rank #1 Strong Buys. They deem these tickers "Most Likely for Early Price Pops."
Since 1988, the full list has beaten the market more than 2X over with an average gain of +23.9% per year. So be sure to give these hand picked 7 your immediate attention.
Want the latest recommendations from Zacks Investment Research? Today, you can download 7 Best Stocks for the Next 30 Days. Click to get this free report
Keep it Clean. Please avoid obscene, vulgar, lewd,
racist or sexually-oriented language. PLEASE TURN OFF YOUR CAPS LOCK. Don't Threaten. Threats of harming another
person will not be tolerated. Be Truthful. Don't knowingly lie about anyone
or anything. Be Nice. No racism, sexism or any sort of -ism
that is degrading to another person. Be Proactive. Use the 'Report' link on
each comment to let us know of abusive posts. Share with Us. We'd love to hear eyewitness
accounts, the history behind an article.



(0) comments
Welcome to the discussion.
Log In
Keep it Clean. Please avoid obscene, vulgar, lewd, racist or sexually-oriented language.
PLEASE TURN OFF YOUR CAPS LOCK.
Don't Threaten. Threats of harming another person will not be tolerated.
Be Truthful. Don't knowingly lie about anyone or anything.
Be Nice. No racism, sexism or any sort of -ism that is degrading to another person.
Be Proactive. Use the 'Report' link on each comment to let us know of abusive posts.
Share with Us. We'd love to hear eyewitness accounts, the history behind an article.